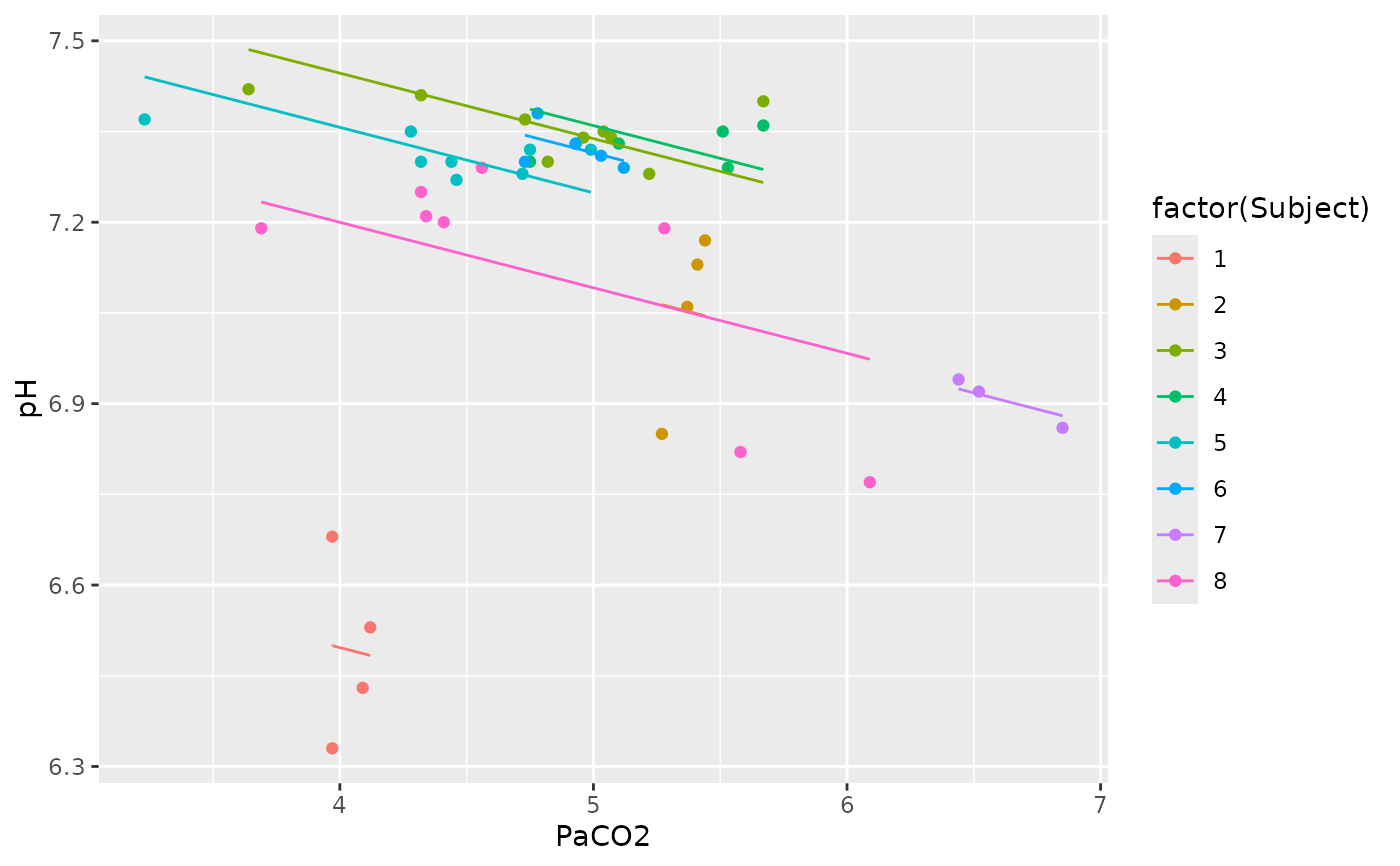
plot.rmc produces a scatterplot of measure1 on the x-axis and
measure2 on the y-axis, with a different color used for each subject.
Parallel lines are fitted to each subject's data.
Usage
# S3 method for class 'rmc'
plot(x, palette = NULL, xlab = NULL, ylab = NULL, ...)
Arguments
- x
an object of class "rmc" generated from the
rmcorrfunction.- palette
the palette to be used. Defaults to the RColorBrewer "Paired" palette
- xlab
label for the x axis, defaults to the variable name for measure1.
- ylab
label for the y axis, defaults to the variable name for measure2.
- ...
additional arguments to
plot.
Examples
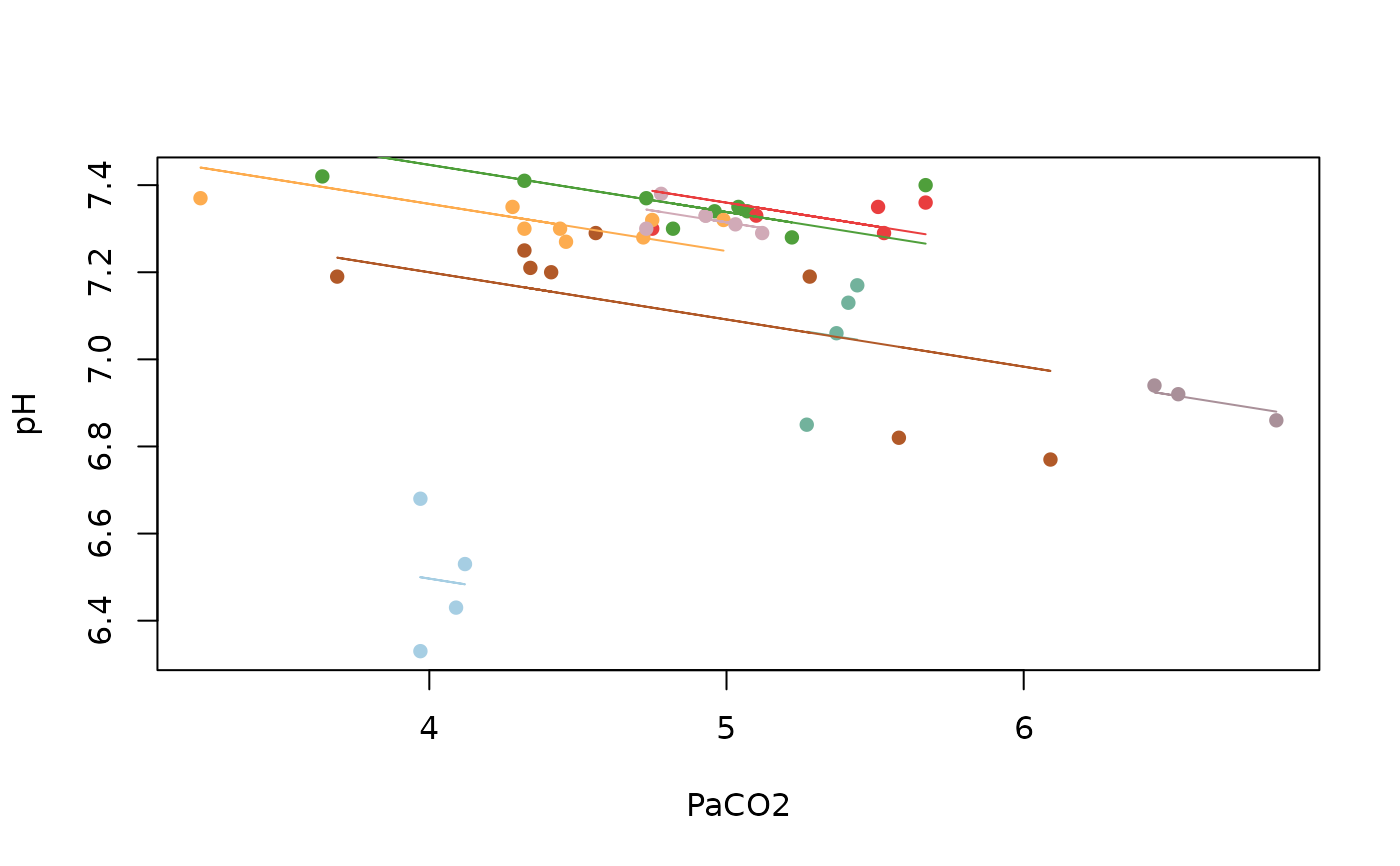
## Bland Altman 1995 data
my.rmc <- rmcorr(participant = Subject, measure1 = PaCO2, measure2 = pH,
dataset = bland1995)
#> Warning: 'Subject' coerced into a factor
plot(my.rmc)
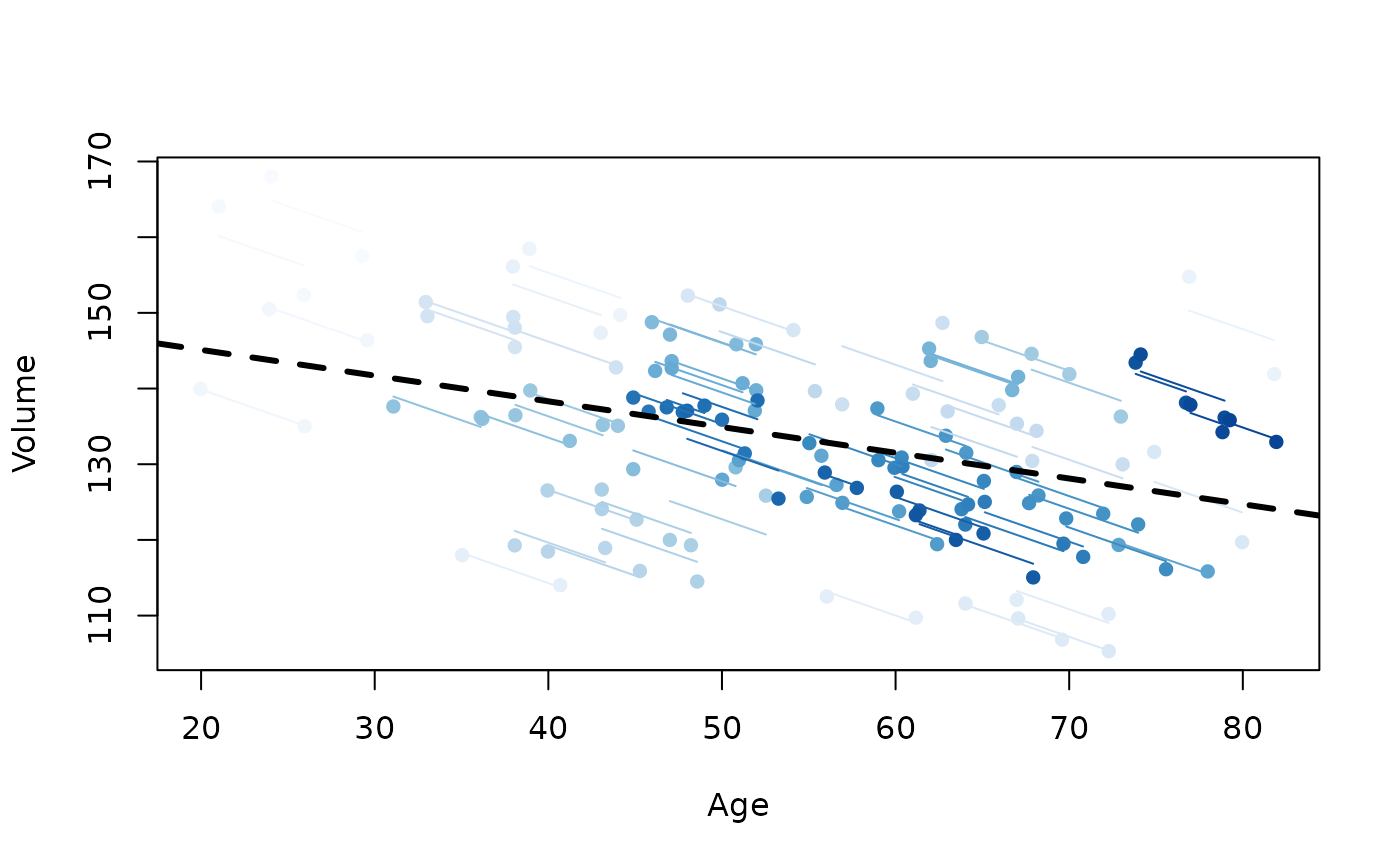
 ## Raz et al. 2005 data
my.rmc <- rmcorr(participant = Participant, measure1 = Age, measure2 =
Volume, dataset = raz2005)
#> Warning: 'Participant' coerced into a factor
library(RColorBrewer)
blueset <- brewer.pal(8, 'Blues')
pal <- colorRampPalette(blueset)
plot(my.rmc, overall = TRUE, palette = pal, overall.col = 'black')
## Raz et al. 2005 data
my.rmc <- rmcorr(participant = Participant, measure1 = Age, measure2 =
Volume, dataset = raz2005)
#> Warning: 'Participant' coerced into a factor
library(RColorBrewer)
blueset <- brewer.pal(8, 'Blues')
pal <- colorRampPalette(blueset)
plot(my.rmc, overall = TRUE, palette = pal, overall.col = 'black')
 ## Gilden et al. 2010 data
my.rmc <- rmcorr(participant = sub, measure1 = rt, measure2 = acc,
dataset = gilden2010)
#> Warning: 'sub' coerced into a factor
plot(my.rmc, overall = FALSE, lty = 2, xlab = "Reaction Time",
ylab = "Accuracy")
## Gilden et al. 2010 data
my.rmc <- rmcorr(participant = sub, measure1 = rt, measure2 = acc,
dataset = gilden2010)
#> Warning: 'sub' coerced into a factor
plot(my.rmc, overall = FALSE, lty = 2, xlab = "Reaction Time",
ylab = "Accuracy")